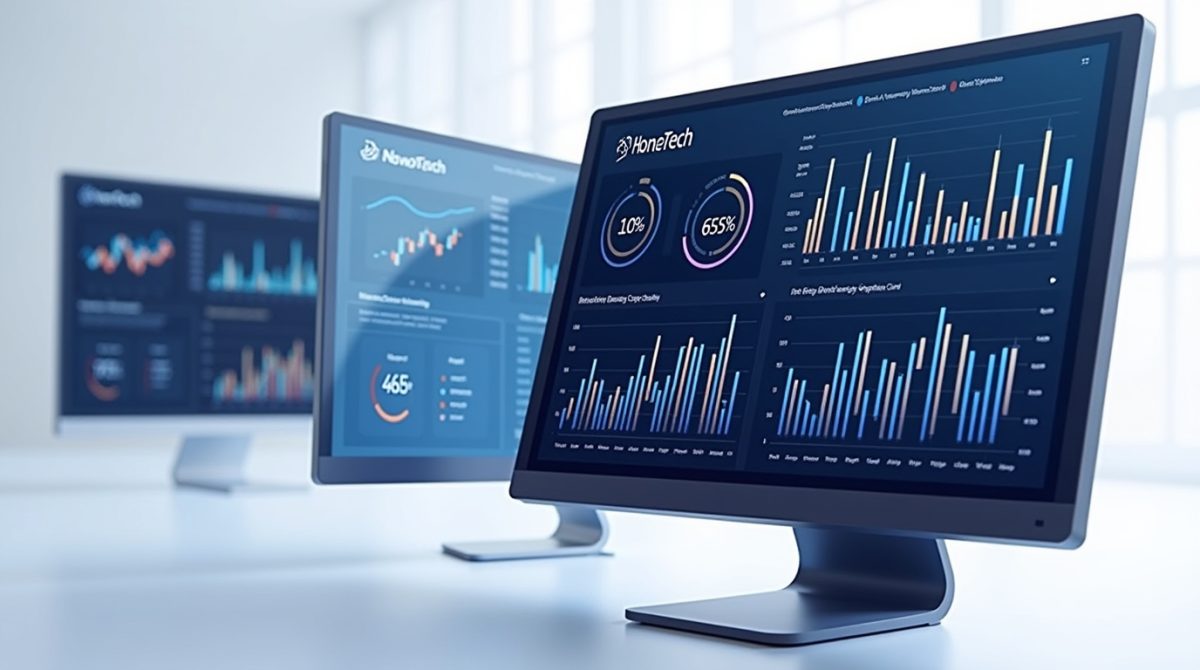

Interactive crypto charts are no longer “nice to have.” They are now a core UX layer in many Web3 products. Users expect fast price views, volume, liquidity, and on-chain context in one screen. They also expect the chart to react in real time.
In 2026, teams building utility-first Web3 apps will focus more on product clarity and user trust. Charts help with both.
What are interactive crypto charts in Web3 products?
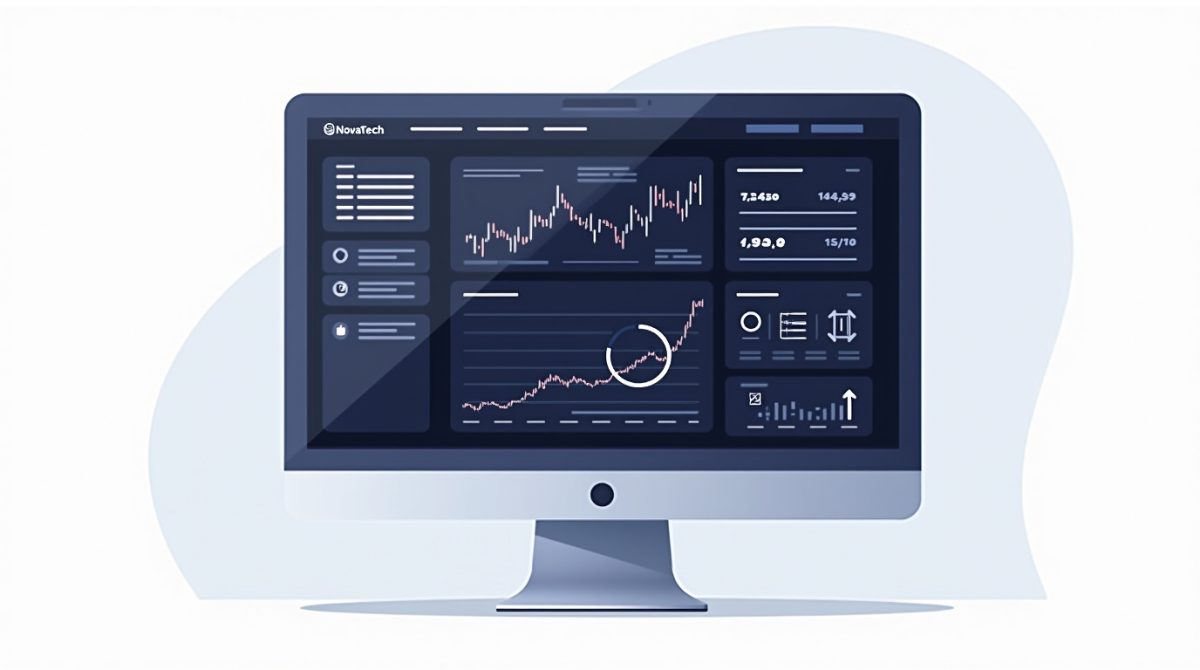
Interactive crypto charts are live chart components that users can touch, zoom, and filter. They usually show:
- Candles or line charts (OHLCV)
- Volume
- Liquidity and market depth signals (when available)
- Timeframes (1m, 5m, 1h, 1d)
- Indicators (optional)
Centralized market data, DEX pool data, or both can power them.
Why charts matter in Web3 product development
1) Charts reduce user doubt
If users cannot verify price and activity fast, they hesitate. A clear chart reduces friction in swaps, staking, and token dashboards.
2) Charts improve product decisions
Teams use chart interaction data to learn what users care about. Example: timeframes, volatility, and liquidity events.
3) Charts make tokenization products feel real
Tokenization needs trust. A good chart helps users see activity and credibility. This matters for RWA tokens too, even if pricing is not “market-driven” every minute.
Common chart types used in Web3 apps
DEX pool charts
These are used for swaps, token pages, and launch tracking. Many teams use DEX data sources like DEX Screener and GeckoTerminal.
- DEX Screener provides API endpoints for pairs and token pools across chains.
- GeckoTerminal supports embedded charts through an iframe-style embed flow.
Aggregator market charts
These are used for portfolio views, watchlists, and market overview pages. Teams often use CoinGecko-style market data plans for scale and historical coverage.
Build vs embed
Option A: Embed charts fast
This is best for MVPs and dashboards.
- Faster shipping
- Less maintenance
- Clear baseline UX
Example: GeckoTerminal offers embedded chart options that can be placed in your app via an embed snippet.
Option B: Build a custom chart layer
This is best when you need:
- Custom indicators
- Custom events from your smart contracts
- A fully branded UI
- Advanced performance controls
You still need a data backend. You can source from APIs or from your own indexer.
The data layer: what to plan for
Latency and reliability
Charts are real-time features. Users notice delays. You need caching, retries, and rate-limit handling.
DEX Screener publishes rate limits on several endpoints in its API reference. This matters for production planning.
Cost and usage rules
Market data is not free at scale. You must plan for pricing and terms.
- CoinGecko shows tiered API plans and call credits.
- CoinGecko also publishes terms and API terms. You should review them before embedding or redistributing data.
Onchain truth vs market truth
DEX charts reflect pool activity. They can also reflect manipulation on low liquidity pools. Your product should show warnings for low liquidity and high price impact.
UX patterns that work in 2026
- Default to a simple timeframe like 1D or 1W
- Add “liquidity” and “market cap” only if you can support accuracy
- Provide a clear toggle between CEX market data and DEX pool data
- Add event markers for contract actions like mint, burn, vesting unlock, and listings
- Use plain labels like “price,” “volume,” “liquidity,” “holders”
Volatility also drives chart usage. Market volatility and trading activity trends are often highlighted in industry reporting.
Tokenova view for UAE teams
Tokenova is a tokenization and Web3 counseling firm active in the UAE region. We see charts as part of compliance and trust, not only design.
If you are building a token or tokenized asset product in the UAE:
- Decide what your “truth source” is. DEX pool, exchange price, or an internal NAV.
- Add user protection UI. Show liquidity, spread, and risk notes.
- Keep data rights clean. Use providers with clear terms and predictable pricing.
- Build for scale early. Rate limits can break dashboards during launches.
FAQ
What is the best chart source for a DEX token page?
For DEX-first tokens, use DEX pool data. Many teams use providers like DEX Screener or GeckoTerminal for pools and embeds.
Should I embed a chart or build one?
Embed for speed and MVP. Build when you need deep customization, event markers, or strict UX control.
What do I need to check before using a data API?
Check pricing, rate limits, and usage terms. CoinGecko and others publish pricing and terms for their APIs.